First I need to export the data from BioRad CFX manager.
- Click Export
- Go to Export All Data Sheets
- Select CSV as export file type
This causes a ton of CSV's to be produced most of them have absolutely no value for PCR Miner. The one we need is titled: Quantification Amplification Results _ FAM. FAM denotes the luminescence frequency which picked up the lumination from the SYBR green dye.
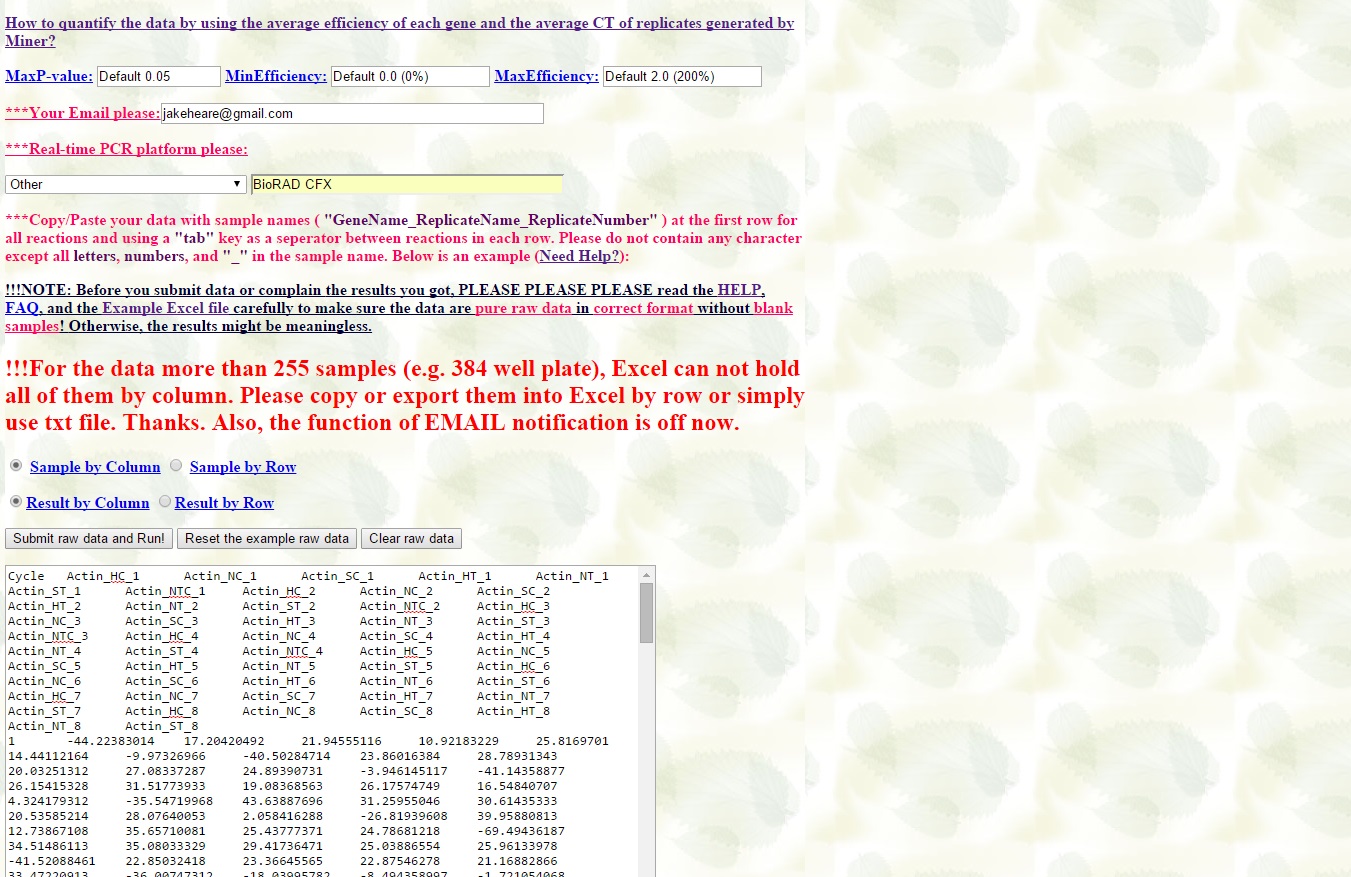
Now we need to format this file.
- Rename each column with the appropriate Gene, Replicate, and sample Number.
Now you just need to copy the data into the entry area of PCR Miner.
PCR Miner pops out the data which you will download from the following screen:
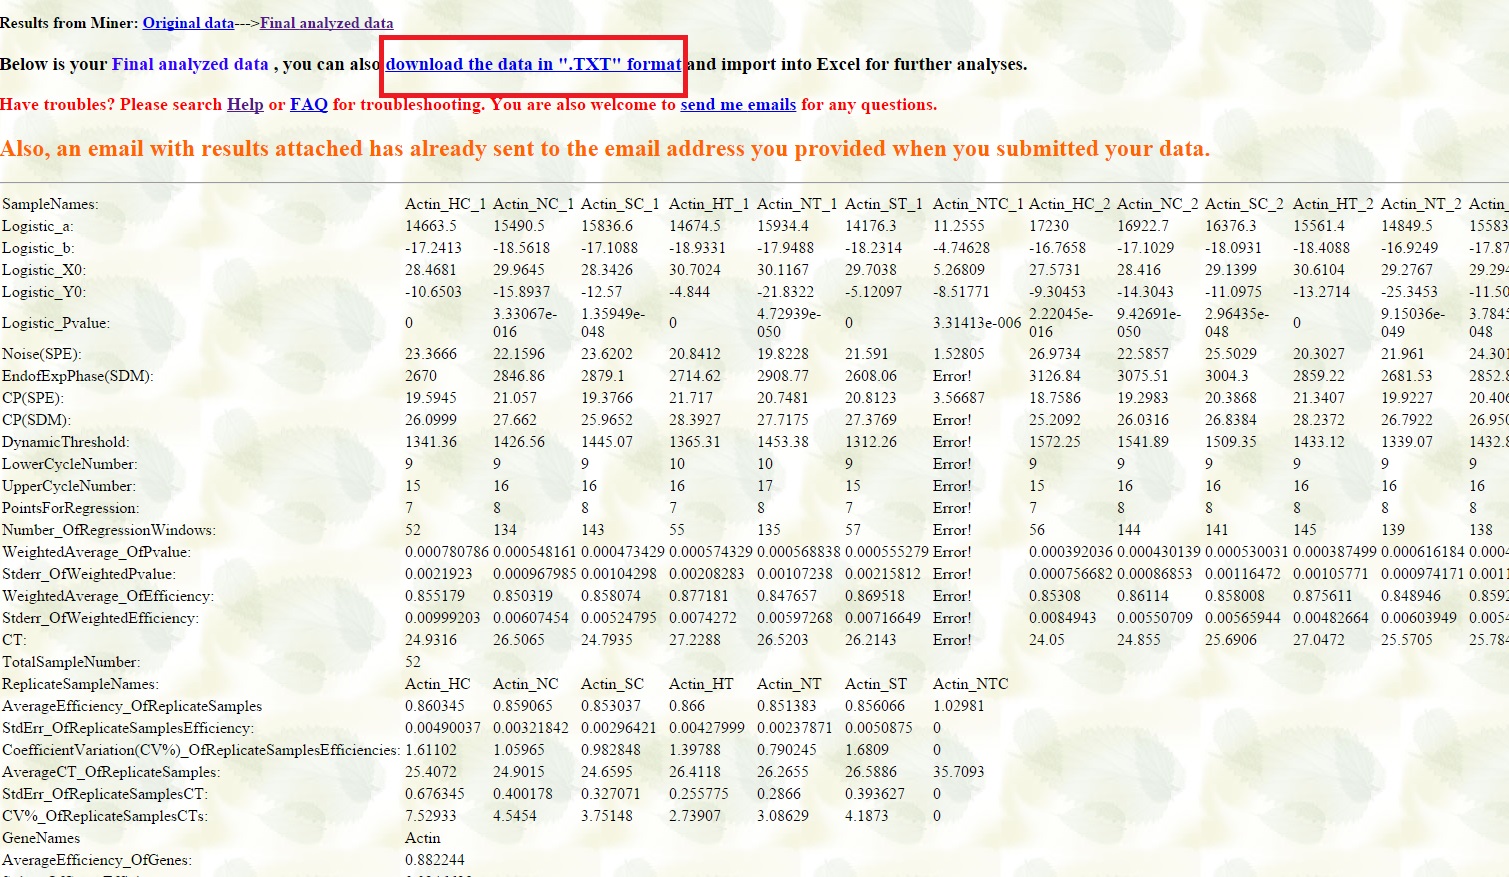
Then this text file can be opened in Excel. Once in excel I highlighted the Cycle threshold value and the efficiency for each population. Then I created the expression value with the equation =1/(1+Efficiency)^CycleThreshold. I did this with both the TLR2.1 and Actin genes. Finally I divided the TLR2.1 expression values by the Actin expression values to get the normalized expression value of TLR2.1.
This is just the first full run using 8 samples per population per treatment but we can see some interesting trends. Expression of TLR2.1 is nearly doubled in the Fidalgo population (N) and tripled in the Oyster Bay population (S) due to Heat Stress. The values for the Dabob population are a little dubious due to the lack of expression from about half the population. Though it does show that while expression seems to be down regulated, it is roughly the same between control and treatment.